Product Analytics — see which products are growing, which are dying, and which channels are driving it
If you manage more than a handful of SKUs, you already live the 80/20 problem: roughly 20% of your products drive 80% of your revenue — but the long tail quietly declining, the winner you should be reordering harder, the SKU that's thriving on Amazon while it collapses on your Shopify store — none of that is visible without exporting sales orders and reconciling them by hand. Product Analytics turns the sales, purchasing, COGS, and inventory data SKU already holds into a single decision-making surface: a macro dashboard that ranks every product, a weighted performance scorecard on each one, and a true per-channel breakdown of where the revenue is actually coming from.
✨ What this means for you:
- A macro dashboard that ranks your entire catalog by growth, sales volume, profit, and margin — sortable, on one screen.
- Hottest and Coldest products surfaced automatically, with seasonality-aware growth math so a half-finished period never gets compared against a full one.
- A performance scorecard on every product — a single 1–5 score built from gross margin, GMROI, sales growth, sell-through, stock cover, and return rate, always expandable to its components.
- A per-product Analytics tab with KPIs, trend charts, and a breakdown of how that SKU performs channel by channel.
- YoY / QoQ / MoM / custom period comparison applied consistently across every metric.
A macro view of your whole catalog
Open Insights → Product Analytics for the portfolio view. KPI cards across the top show total sales volume, units sold, profit, and active products — each against the prior period with a signed delta. Below them, Hottest and Coldest Products call out the biggest movers automatically, and a Growth Heatmap plots every product against time so a cooling SKU shows up as a row turning red months before it would ever land on your radar.
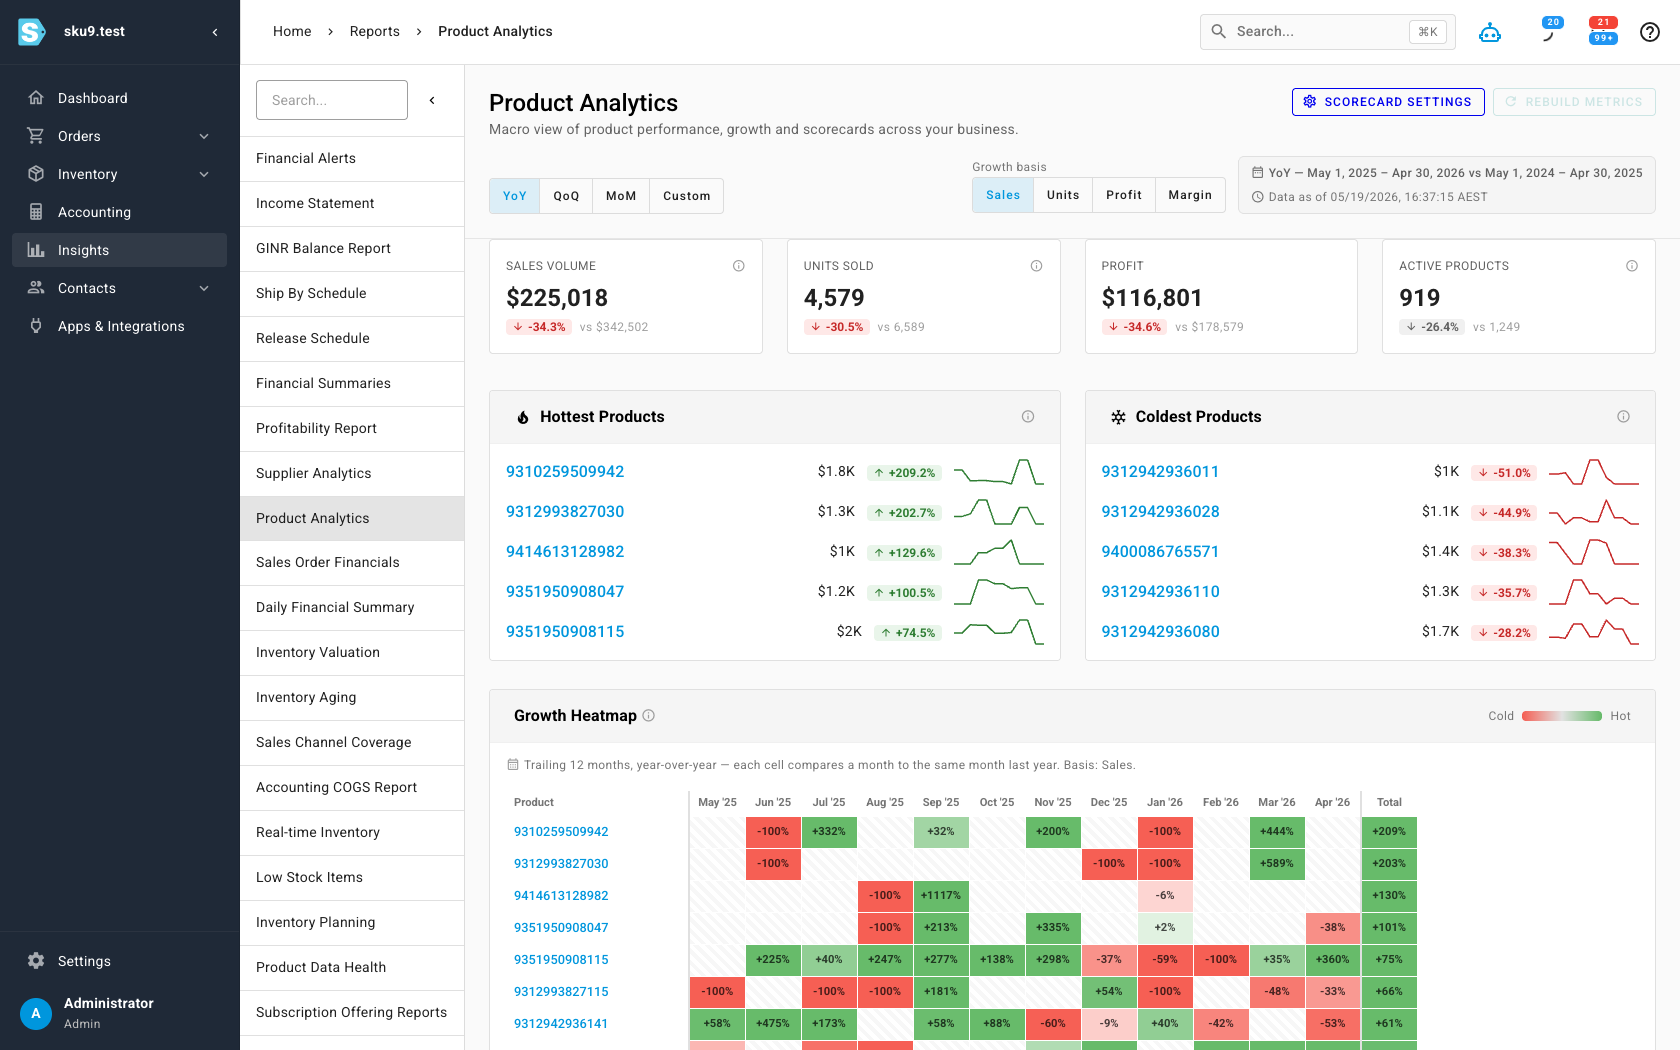
The period toggle (YoY, QoQ, MoM, Custom) and the growth basis (Sales, Units, Profit, Margin) re-frame the entire dashboard at once — so you can ask "what grew the most this quarter by profit" without touching a spreadsheet. A sortable Product Leaderboard at the bottom ranks every product with its sales, profit, margin, growth, sell-through, and on-hand stock side by side.
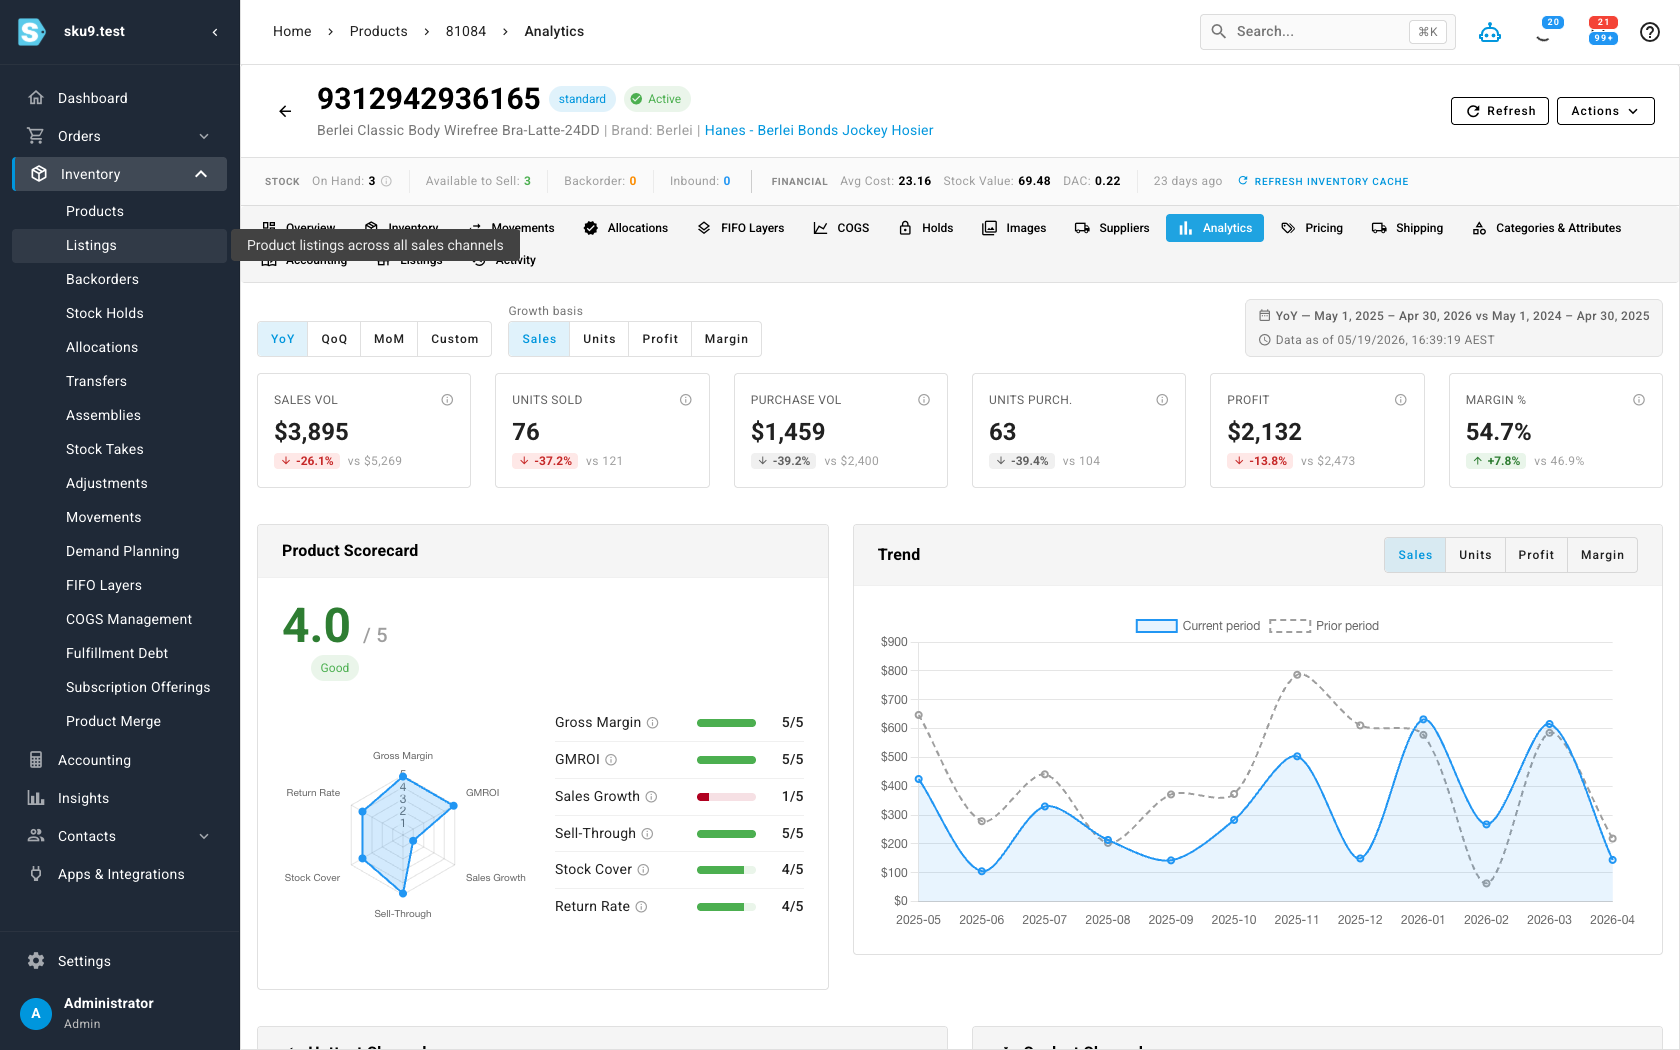
A scorecard for every product
Every product gets an Analytics tab on its detail page. It opens with the KPIs for that SKU, a trend chart you can switch between sales, units, profit, and margin — and the Product Performance Scorecard: a single 1–5 score that distills profitability, demand, inventory health, and quality into one signal, with a radar chart breaking out each dimension so you can always see which part is strong or weak.
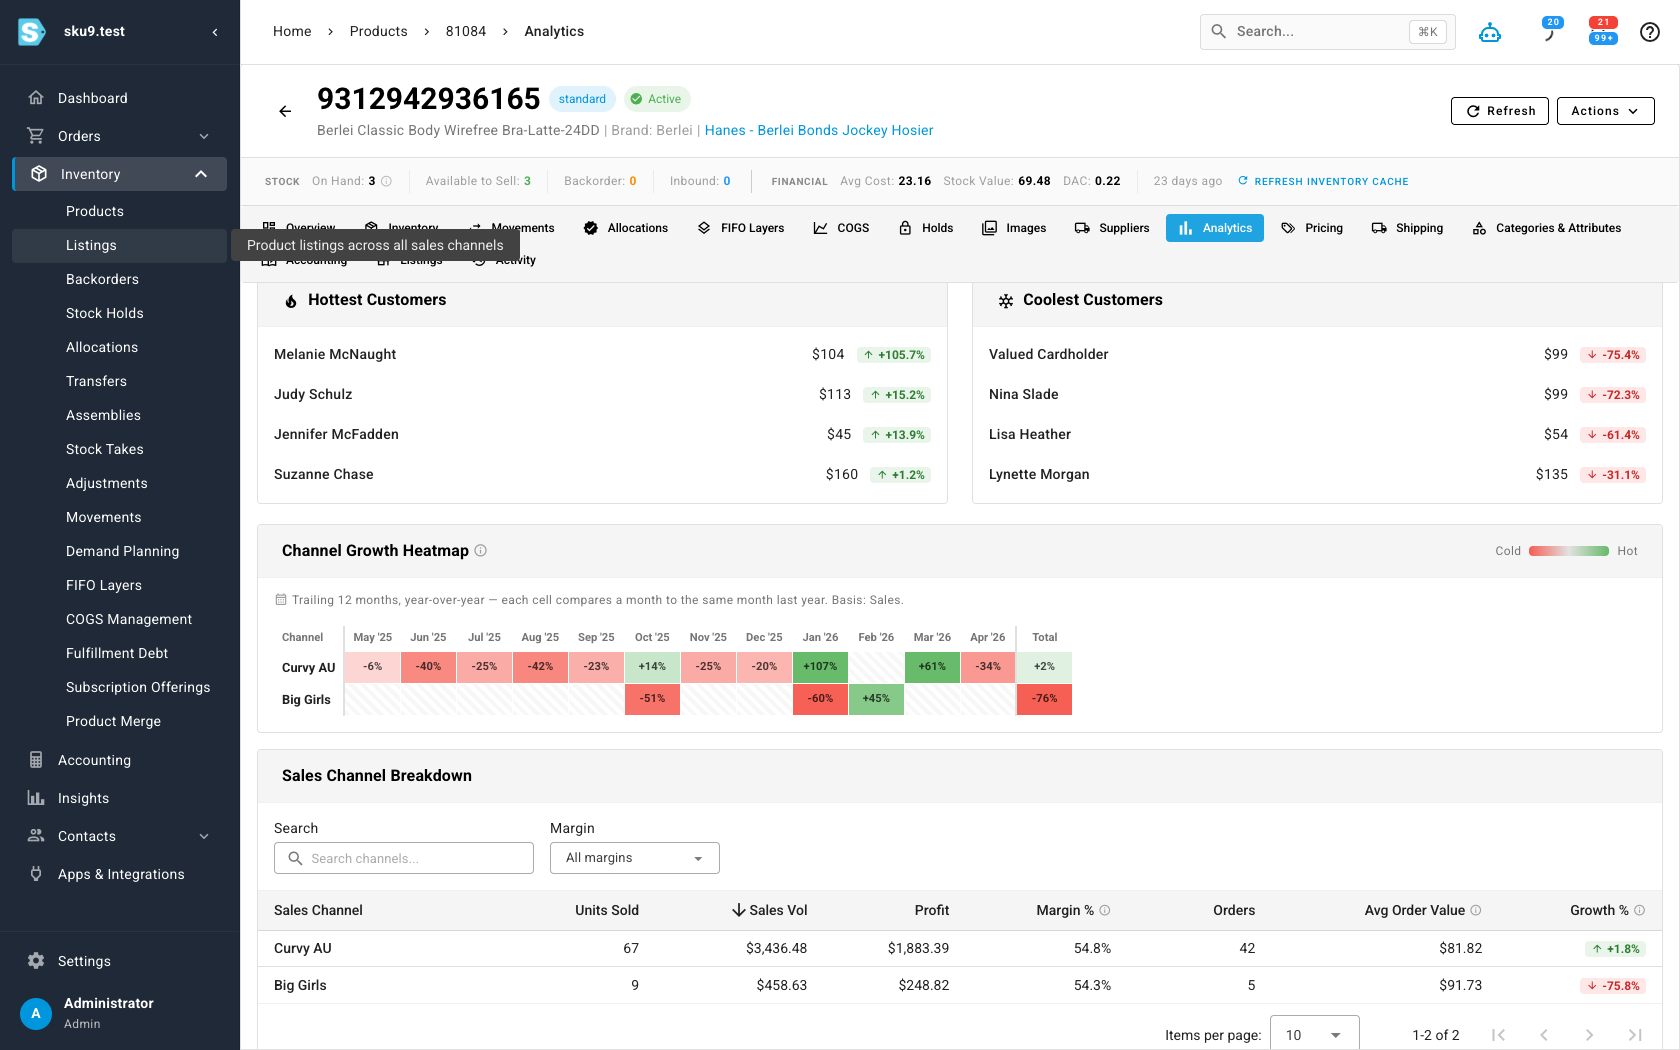
Broken down by sales channel
The real question for a multichannel seller isn't just "how is this product doing" — it's "where." The Analytics tab breaks each product down by the channels it sells through, with units, revenue, profit, margin, orders, and average order value per channel, plus its own hottest/coldest channels and a channel growth heatmap. That's how you catch a SKU that's thriving on one marketplace and quietly dying on another.
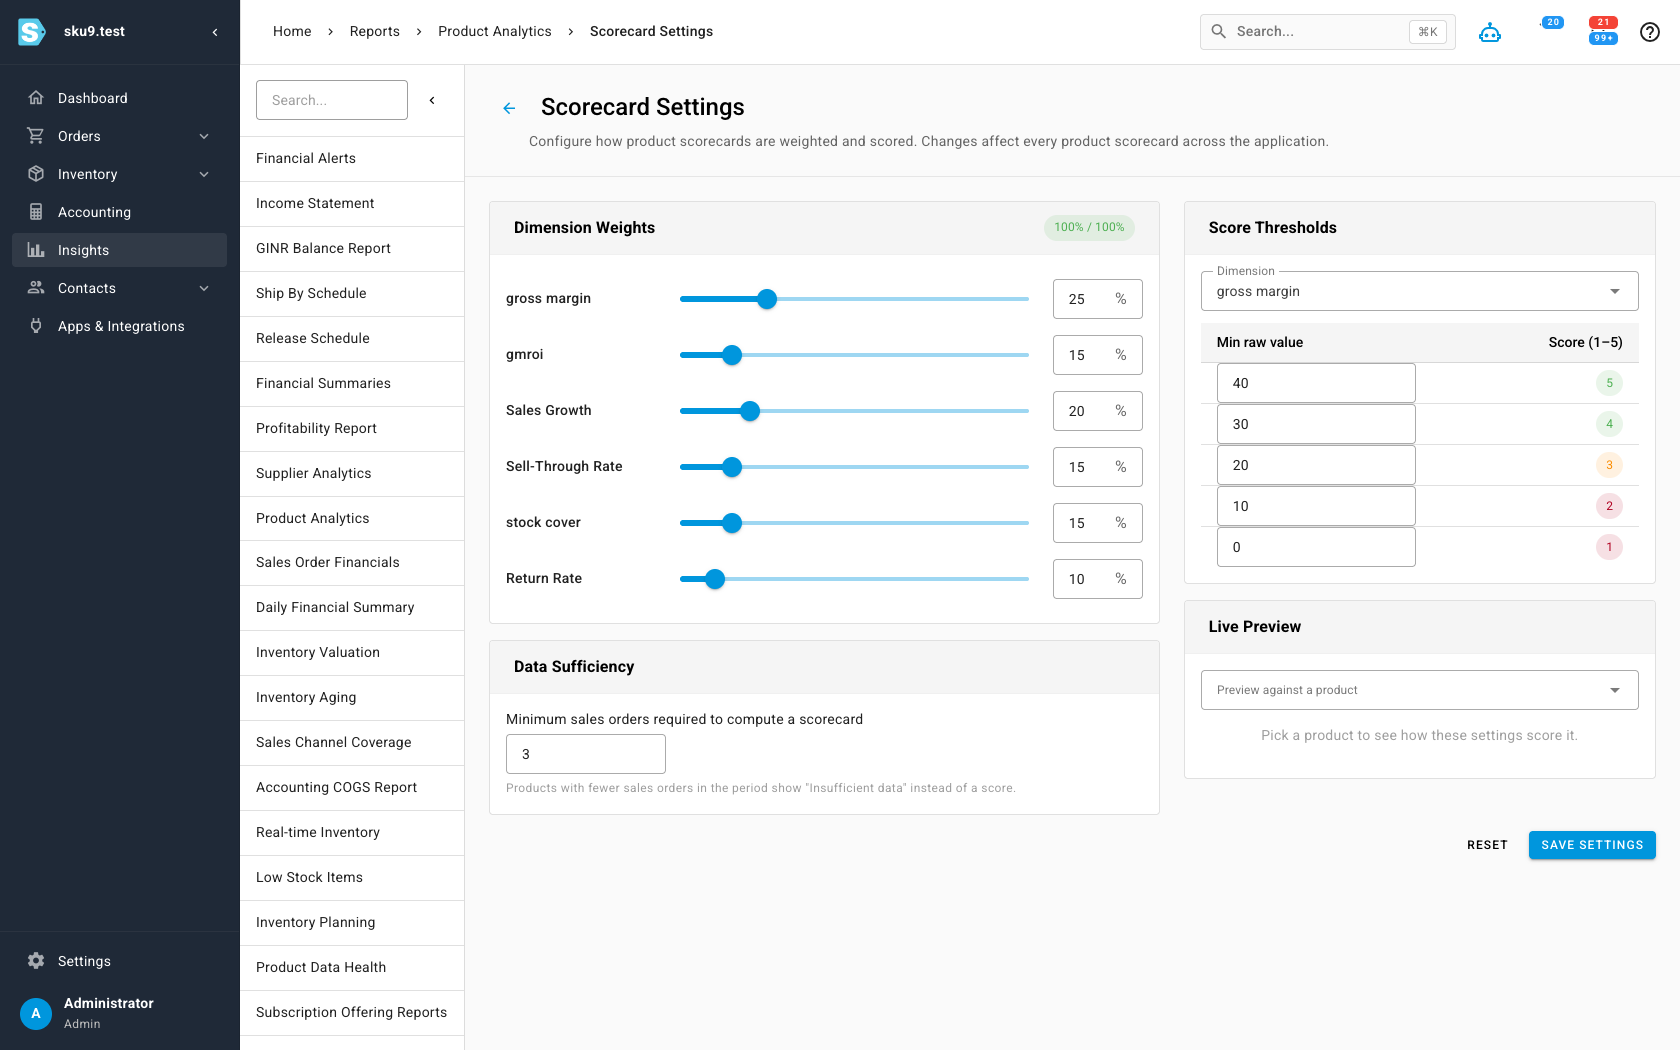
Tune the scorecard to your business
The composite score isn't a black box. Scorecard Settings lets you set the weight of each dimension — gross margin, GMROI, sales growth, sell-through, stock cover, return rate — and the raw-value thresholds that map to each 1–5 band. A distributor competing on margin and a high-velocity seller competing on turn can each tune the score to mean what it should for them. There's also a minimum-orders threshold so low-sample SKUs show "insufficient data" instead of a misleading score.
Where to find it
Open Insights → Product Analytics for the macro dashboard, leaderboard, and movers. Every product's own numbers live on the Analytics tab of its detail page, and the scoring rules are under Scorecard Settings from the dashboard header.